
[Update Nov 23, 2022: Added perf graphs at the end of this article]
TL;DR: Increase Python’s GC allocation threshold from 700 to 50,000 at app startup with gc.set_threshold(50_000, ...) and use gc.freeze() to exclude startup objects. We saw 20% faster responses at Talk Python with no increase in memory usage.
Here’s a bold statement given that I know nothing about you or your app:
Your Python GC settings are wrong and they are hurting your performance.
Let me elaborate. Python has two types of memory management:
- Primarily reference counting. Objects keep track of the number of variables pointing at them. If that number reaches 0, they are instantly deleted, deterministically. Without stats to back this, I’d guess 99.9%+ of all memory is handled this way.
- The 0.1%: The one case that fails hard here is if you have a cycle (think Person object which has a spouse field). Enter garbage collection. This runs occasionally looking for missed ref count clean-ups.
Ref counting is great but the GC, it runs too often.
The trigger is when you allocate 700 or more container objects (classes, dicts, tuples, lists, etc) more than have been cleaned up, a GC cycle runs.
Imaging you’re doing a query:
recent = await PageHits.objects().filter(date >= today).to_list()
If there are anywhere near 700 results in that query, you’re hitting GC cycles before you even get the full list back.
Our sitemap at Talk Python Training was resulting in 77 GC cycles to just load the page, 77!
training.talkpython.fm/sitemap.xml
Yikes.
But you can change it. Try this code at app startup:
# Clean up what might be garbage so far.
gc.collect(2)
# Exclude current items from future GC.
gc.freeze()

allocs, gen1, gen2 = gc.get_threshold()
allocs = 50_000  # Start the GC sequence every 50K not 700 allocations.
gen1 = gen1 * 2
gen2 = gen2 * 2
gc.set_threshold(allocs, gen1, gen2)
Of course, your mileage will vary. But at Talk Python, we saw a 20% overall speed up with no change in the memory usage.
If you want to dive much deeper into this, check out my recent video showing this live where we got 2x perf with just this code for a simpler example:

Dive in with my Full Course
If this all sounds interesting and you want some practical, hands-on experience and a solid look behind the scenes about how Python memory works and what knobs you have to control it, check out my full course over at Talk Python Training: Python Memory Management and Tips Course.
Real-World Performance Results
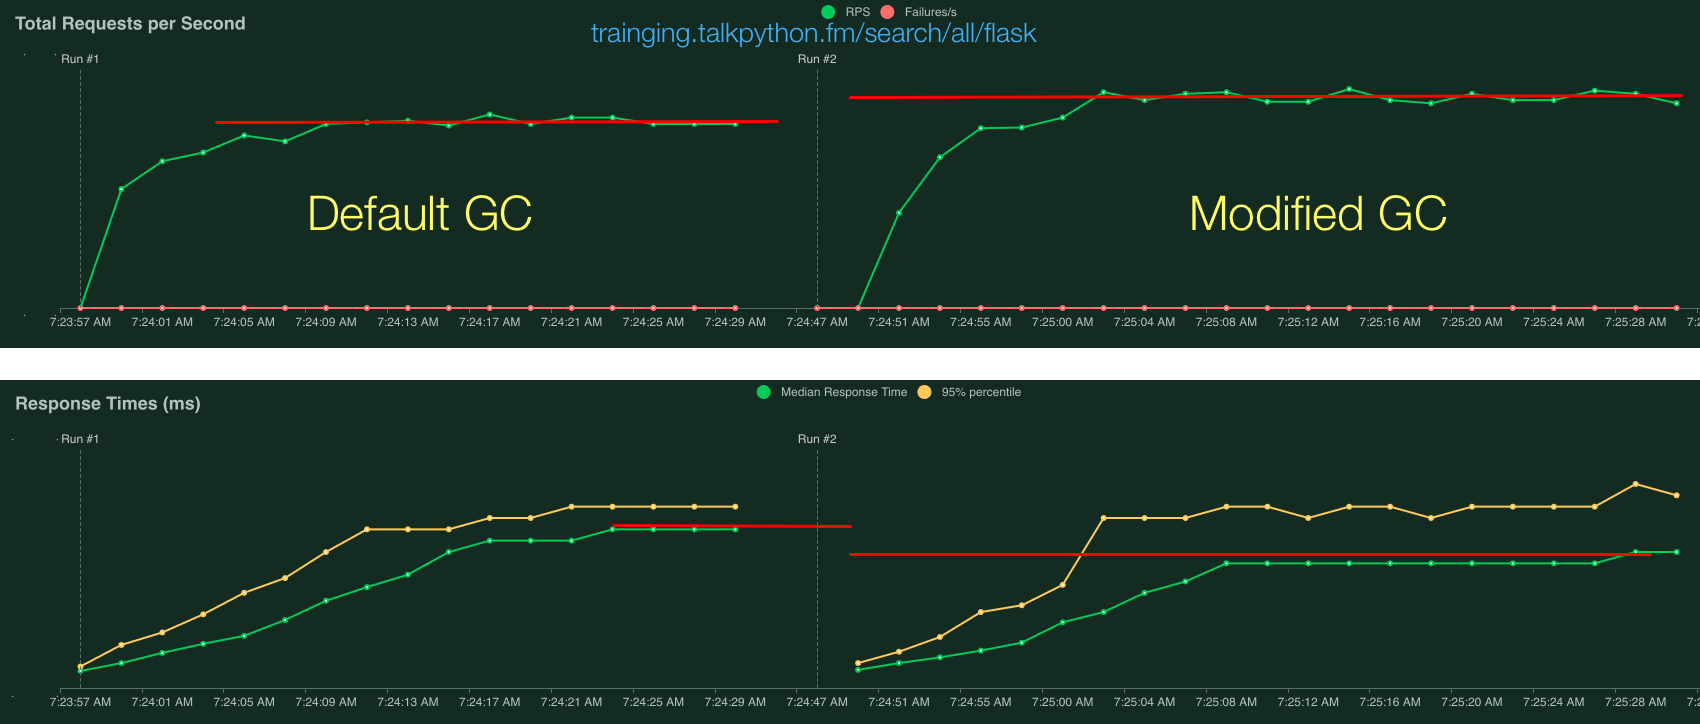
There has been a bit of debate on how realistically this improvement is for real workloads. I can’t test yours, but here are two production end-to-end requests from Talk Python Training.
I used locust to run some performance tests against two URLs on our site:
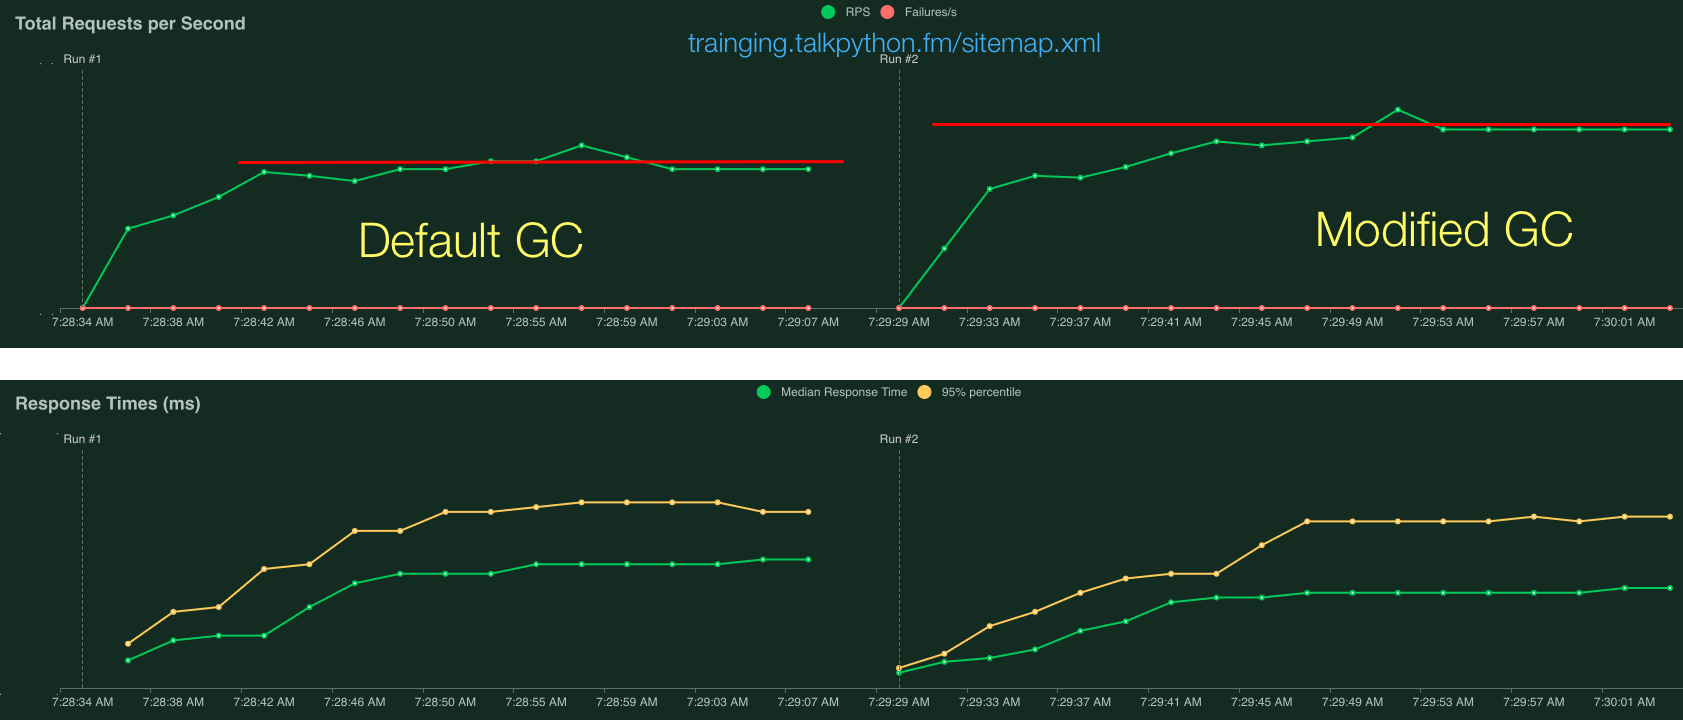
These both showed clear > 20% improvements:
Search:
Sitemap:
Discussion
This post got a decent amount of discussion. You can see it over on the Mastodon thread.